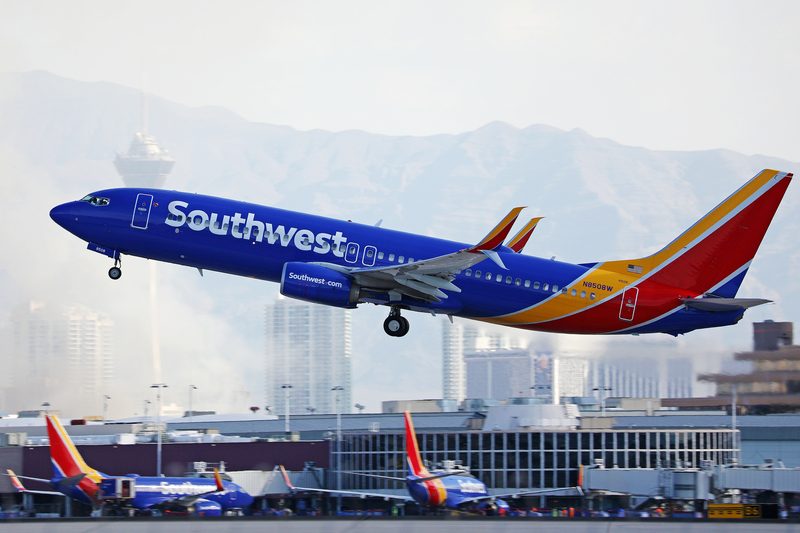
Southwest Airlines entered 2026 as North America’s most punctual carrier. Five months later, it finished June with the lowest on-time performance rate among the major U.S. airlines included in OAG’s monthly rankings.

Southwest recorded a 64.94% on-time arrival rate in June, down from 79.75% in January. The 14.81-percentage-point decline means that more than one-third of the airline’s tracked flights failed to arrive within 15 minutes of schedule during the final month of the first half.
The deterioration is substantial, but it requires context. Southwest continued completing nearly all of its scheduled flights, recording a June cancellation rate of just 0.53%. Its passengers were considerably more likely to arrive late than those traveling on competing airlines, but they were still less likely to have their flights canceled than customers on several of the largest U.S. carriers.
Read our stories in your inbox
Two aviation newsletters. Zero fluff.
The distinction between delays and cancellations is central to understanding Southwest’s performance. The airline did not experience a broad operational collapse in which thousands of flights simply failed to operate. Instead, delays repeatedly moved through its dense domestic network, following aircraft and crews from one airport to the next.
Southwest Lost 14.8 Points in Five Months
According to OAG’s North American on-time performance data, Southwest began the year with a 79.75% on-time arrival rate in January. That placed the airline narrowly ahead of Alaska Airlines, which finished the month at 79.31%.
By June, Southwest’s performance had fallen to 64.94%. OAG ranked it 17th among 18 qualifying North American airlines, ahead only of the much smaller Canadian operator Air Inuit, which recorded a 54.47% result.
That means Southwest was not literally last among every airline in North America. It was, however, the lowest-ranked major U.S. passenger carrier in the June table.
The decline was also gradual rather than the product of one disastrous weekend. Southwest remained in the mid-to-upper 70% range through much of the spring before falling to approximately 71% in May and then below 65% in June.
OAG’s figures show a carrier losing operational consistency as the summer travel season intensified—not an airline moving from first to last because of a single storm system or isolated technical event.
How Southwest Compared With Other U.S. Airlines in June
The June results show how far Southwest had fallen behind its direct competitors.
| U.S. airline | June on-time rate | Cancellation rate |
|---|---|---|
| Breeze Airways | 81.82% | 0.55% |
| Delta Air Lines | 81.32% | 1.43% |
| Alaska Airlines | 80.38% | 0.76% |
| JetBlue Airways | 77.66% | 1.27% |
| United Airlines | 75.00% | 1.17% |
| Sun Country Airlines | 74.86% | 0.79% |
| American Airlines | 72.21% | 3.10% |
| Frontier Airlines | 70.97% | 1.50% |
| Allegiant Air | 68.89% | 0.50% |
| Southwest Airlines | 64.94% | 0.53% |
The difference between Southwest and the leading U.S. carriers was no longer marginal. Breeze and Delta finished nearly 17 percentage points ahead, while Alaska held an advantage of more than 15 points.
Even American Airlines, which suffered extensive weather and air traffic control disruption during June, finished more than seven percentage points ahead of Southwest in on-time arrivals.
Southwest’s result was based on 124,517 tracked flights, giving it one of the largest operational samples in the OAG table. The airline’s ranking cannot therefore be dismissed as an anomaly caused by a small schedule or a handful of irregular operations.
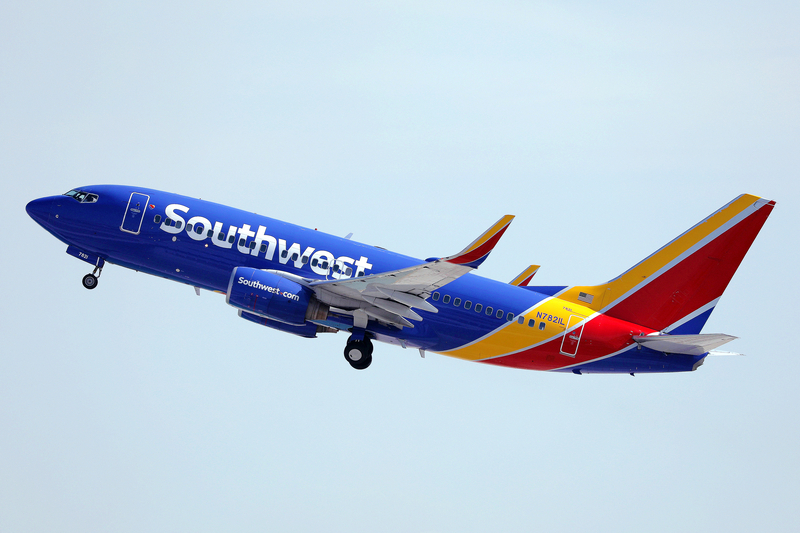
The Low Cancellation Rate Is an Important Counterpoint
Southwest canceled 0.53% of its June flights, equivalent to approximately one cancellation for every 189 scheduled departures.
That was substantially better than American’s 3.10% cancellation rate and also lower than the rates reported by Delta, United, JetBlue, Frontier, Alaska, and several other carriers.
Southwest’s operational problem was therefore not an inability to complete its schedule. It was an inability to complete enough of that schedule on time.
For passengers, the distinction can be meaningful. A flight arriving 60 or 90 minutes late may still allow a traveler to reach the intended destination on the same day. A cancellation can result in an overnight stay, a missed cruise or international connection, or a wait of several days when later departures are already full.
For the airline, completing a delayed flight can also help restore aircraft and crews to locations where they are needed for the following day. Canceling it may solve an immediate scheduling problem while creating a larger aircraft-positioning problem elsewhere in the network.
The cancellation figure is consequently a genuine operational strength. It should not, however, obscure how disruptive a 64.94% on-time rate is for passengers, airport employees, crews, and the airline’s remaining schedule.
Federal Data Shows Late Aircraft Were the Largest Delay Category
The latest detailed federal statistics available during July provide a clearer picture of what was happening before Southwest’s particularly weak June result.
The Department of Transportation’s July 2026 Air Travel Consumer Report covers domestic operations during May. It lists 120,646 Southwest flights and an on-time arrival rate of 71.88%.
The results were divided as follows:
| May 2026 Southwest outcome | Flights | Share of scheduled flights |
| Arrived on time | 86,726 | 71.88% |
| Air carrier delay | 10,776 | 8.93% |
| Extreme weather delay | 441 | 0.37% |
| National Aviation System delay | 5,810 | 4.82% |
| Security delay | 96 | 0.08% |
| Late-arriving aircraft delay | 15,984 | 13.25% |
| Canceled | 474 | 0.39% |
| Diverted | 320 | 0.27% |
Late-arriving aircraft represented Southwest’s largest individual delay category. Nearly 16,000 May flights were delayed because the Boeing 737 assigned to operate them had arrived late from an earlier segment.
The 13.25% figure represents the share of all scheduled Southwest flights—not merely the share of delayed flights. Air carrier delays under Southwest’s control, including problems involving maintenance or crews, accounted for another 8.93%.
National Aviation System delays, which can include non-extreme weather, airport congestion, air traffic control restrictions, and high traffic volume, accounted for 4.82%. Extreme weather was directly assigned as the primary cause for only 0.37% of scheduled flights.
Those categories should not be interpreted too rigidly. A morning thunderstorm at Denver International Airport (DEN), for example, may delay an aircraft’s first departure. When that same airplane arrives late at Harry Reid International Airport in Las Vegas (LAS), its next flight can be recorded as a late-arriving-aircraft delay rather than another weather delay.
Weather can therefore initiate a disruption that later appears in the statistics under a different category.
Southwest’s Network Allows Delays to Travel With the Aircraft
Southwest is often described as a point-to-point carrier, but that phrase can create the impression that each flight operates independently. In reality, its Boeing 737s frequently fly a series of consecutive segments across the country during the same operating day.
An aircraft might begin at Baltimore/Washington International Airport (BWI), continue to Nashville International Airport (BNA), fly to Dallas Love Field (DAL), and then operate onward to Phoenix Sky Harbor International Airport (PHX) or Oakland International Airport (OAK).
A delay on the first flight can follow the same aircraft through every subsequent station.
Southwest’s network includes major operating concentrations at airports such as:
- Denver International Airport (DEN)
- Baltimore/Washington International Airport (BWI)
- Chicago Midway International Airport (MDW)
- Dallas Love Field (DAL)
- Harry Reid International Airport in Las Vegas (LAS)
- Phoenix Sky Harbor International Airport (PHX)
- Nashville International Airport (BNA)
- Orlando International Airport (MCO)
- William P. Hobby Airport in Houston (HOU)
- Oakland International Airport (OAK)
These are not traditional connecting hubs in exactly the same sense as American’s operation at Dallas/Fort Worth International Airport (DFW) or Delta’s at Hartsfield-Jackson Atlanta International Airport (ATL). Nevertheless, they handle large numbers of Southwest aircraft, crews, and connecting passengers.
When thunderstorms reduce capacity at Denver (DEN) or Baltimore (BWI), the effects do not remain at those airports. Aircraft depart late for Las Vegas (LAS), Chicago-Midway (MDW), Nashville (BNA), and Orlando (MCO), where they are scheduled to operate additional flights.
A disruption that begins with weather or air traffic control restrictions can become a late-aircraft problem for the remainder of the day.
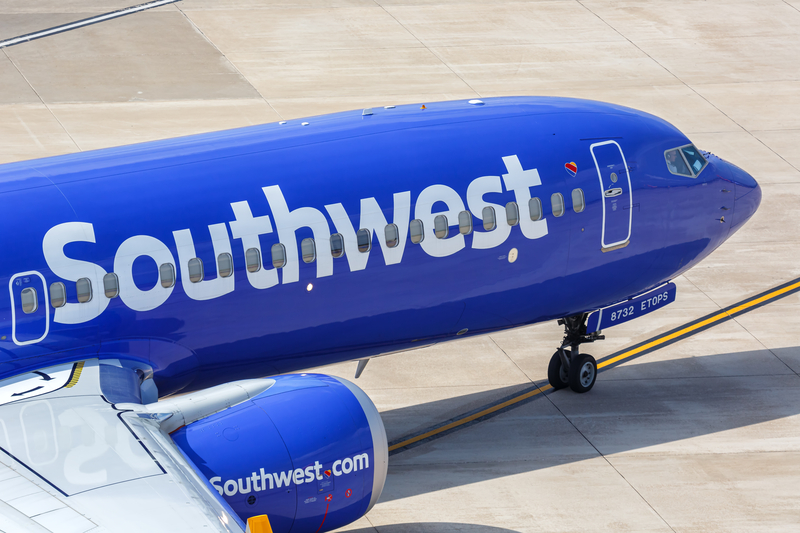
Rolling Delays Can Be Harder to Eliminate Than Cancellations
A hub-and-spoke airline can sometimes isolate disruption within one connecting bank. It may cancel a group of flights, protect the next bank, substitute aircraft, or use reserve crews concentrated at a major hub.
Southwest’s rolling schedule provides different advantages, but it can make recovery more difficult once delays are moving through the system.
Aircraft and crews are spread across numerous airports rather than overwhelmingly concentrated at a small number of fortress hubs. The airline may complete a delayed flight because it needs the aircraft at the destination for several later segments.
That decision protects the completion factor, but it can also preserve the delay.
Consider a Boeing 737 scheduled to operate five flights. If the first segment departs 75 minutes late and the airline cannot recover that time during later turns, all five flights may be counted as delayed. Southwest has completed the full schedule, but one initial event has generated five poor on-time results.
A cancellation can stop the sequence, but it creates its own consequences. Passengers must be reaccommodated, the aircraft may be left at the wrong airport, and the crew’s remaining assignment may no longer be workable.
Southwest’s June statistics suggest that the airline frequently chose—or was operationally able—to continue flying rather than remove delayed flights from the schedule.
The June 19 Weekend Exposed the Network’s Vulnerability
Southwest’s difficulties became particularly visible during the June 19–21 weekend.
One media tally based on changing FlightAware data counted 5,651 Southwest delays during the three-day period. Severe weather, FAA ground stops, traffic-flow restrictions, and airport congestion affected airlines across the United States, but Southwest’s rolling aircraft rotations allowed the initial disruption to spread widely through its network.
The exact daily totals should be treated as point-in-time estimates rather than final government statistics. Real-time flight trackers continually update their counts as aircraft depart, arrive, cancel, divert, or receive revised timestamps.
The broader conclusion remains valid: Southwest experienced thousands of delayed operations during one of the first major summer travel weekends, and the network struggled to recover between operating days.
That weekend alone does not explain the full June result. OAG’s 64.94% figure covers the entire month and more than 124,000 flights. It does, however, demonstrate how quickly Southwest’s operation can accumulate delays when weather affects several important stations simultaneously.
Weather Was a Factor, but It Does Not Explain Everything
Summer thunderstorms unquestionably affected Southwest’s performance.
Denver (DEN), Baltimore (BWI), Chicago-Midway (MDW), Dallas-Love (DAL), Nashville (BNA), Orlando (MCO), and Houston-Hobby (HOU) are all vulnerable to convective weather during the summer. Even storms that do not pass directly over an airport can close arrival and departure routes or trigger FAA ground-delay programs.
Lightning can stop ramp operations, preventing employees from loading baggage, fueling aircraft, or pushing flights away from the gate. Wind shifts can force airports to change runway configurations, while air traffic controllers must provide greater spacing around thunderstorms.
Those restrictions reduce the number of aircraft an airport can handle each hour.
However, weather affected Southwest’s competitors as well. Delta, United, American, JetBlue, and other carriers operated through many of the same air traffic control constraints and airport closures. Southwest still finished behind all of them in OAG’s June ranking.
The more important question is not whether weather occurred, but why Southwest had greater difficulty absorbing the disruption and restoring its schedule afterward.
Claims of a Southwest Pilot Shortage Need Better Evidence
The original account attributes the broader decline to shortages of trained pilots and airport employees. Publicly available data does not establish that as the primary cause of Southwest’s six-month deterioration.
The quoted comments from Allied Pilots Association spokesperson Dennis Tajer refer specifically to American Airlines. They discuss American’s furloughs, leaves of absence, fleet reductions, and pilot training pipeline.
Those remarks cannot be used as evidence that Southwest was experiencing the same staffing conditions.
Southwest may have encountered localized shortages, crew-assignment problems, reserve limitations, or airport staffing constraints during individual disruptions. The Department of Transportation’s May statistics also show that airline-controlled factors contributed to nearly 9% of its scheduled operations.
That is not the same as proving a systemwide shortage of Southwest pilots.
Without internal crew-availability data, maintenance records, station staffing figures, or a statement from Southwest identifying those shortages as the cause, the staffing explanation remains unconfirmed.
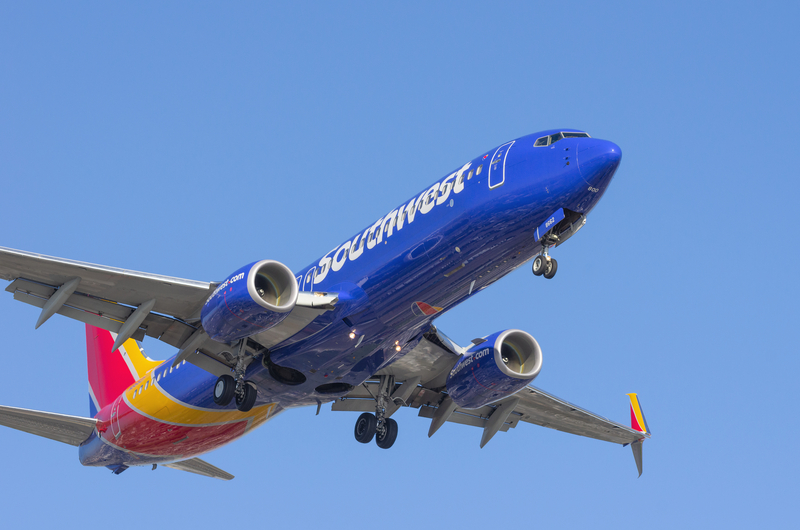
An All-Boeing 737 Fleet Simplifies Operations
Southwest’s entire passenger fleet belongs to the Boeing 737 family. That commonality has historically been one of the airline’s greatest operational advantages.
According to Southwest’s 2025 annual report, the airline ended last year with 803 aircraft:
| Aircraft type | Fleet at end of 2025 | Average age | Current seating |
| Boeing 737-700 | 305 | 20 years | 137 seats after retrofit |
| Boeing 737-800 | 198 | 10 years | 175 seats |
| Boeing 737-8 MAX | 300 | 3 years | 175 seats |
| Total | 803 | — | — |
The Boeing 737-700 and 737-800 belong to the 737 Next Generation family and use CFM International CFM56-7B engines. The newer Boeing 737-8 is part of the 737 MAX family and uses more efficient CFM LEAP-1B engines.
Operating one aircraft family simplifies pilot qualifications, maintenance training, spare-parts inventories, aircraft substitutions, and scheduling. A 737 crew arriving at Dallas-Love (DAL) can generally operate another Southwest 737 without requiring qualification on an entirely different aircraft family.
Fleet commonality cannot prevent delay propagation, however.
If dozens of aircraft arrive late at Denver (DEN), the fact that they are all Boeing 737s does not create additional gates, crews, ramp employees, or usable airspace. Commonality makes substitutions easier, but it cannot overcome a lack of spare aircraft or recover time that has already been lost across multiple rotations.
The 737-700 Fleet Adds Another Operational Consideration
Southwest’s oldest aircraft group is its Boeing 737-700 fleet, which averaged approximately 20 years of age at the end of 2025.
Aircraft age alone does not make an airplane unreliable. Commercial aircraft remain in service through scheduled inspections, structural maintenance, component replacements, engine overhauls, and compliance with FAA airworthiness directives.
An older fleet can nevertheless require more maintenance activity than a newer one. Components accumulate additional flight hours and cycles, while unscheduled defects can become more frequent as systems age.
The 737-700 also carries fewer passengers than Southwest’s 175-seat 737-800s and 737-8s. Substituting a 137-seat aircraft onto a flight planned for a larger 737 may create passenger-accommodation problems even when a spare airplane is technically available.
Southwest has not released evidence showing that 737-700 maintenance directly caused its June performance decline. Fleet age should therefore be viewed as an operating variable rather than a diagnosis.
Assigned Seating Is Another Change Worth Monitoring
Southwest began operating its new assigned-seating system, extra-legroom product, and redesigned boarding process on January 27, 2026.
The change represents a significant departure from the open-seating model that defined the airline for decades. Passenger groups are now organized differently, and travelers must locate assigned rows and seats rather than taking the first acceptable position available.
Operationally, Southwest must determine whether the new process consistently supports the short ground times built into its schedule.
The effects may differ by airport. Boarding at Dallas-Love (DAL), where many passengers are familiar with Southwest, may perform differently from boarding at Orlando (MCO), where flights can include more families, infrequent travelers, and large volumes of carry-on baggage.
No public evidence currently establishes that assigned seating caused the deterioration in on-time performance. OAG’s results had already softened before the peak summer period, but numerous other variables—including weather, aircraft rotations, schedule density, maintenance, and crew recovery—were also changing.
The boarding transition deserves analysis, but it should not be presented as the cause without turn-time data from Southwest.
OAG and DOT Figures Should Not Be Used Interchangeably
Readers may notice that OAG lists Southwest’s January on-time rate as 79.75%, while Department of Transportation data places the airline at 82.4% for the same month.
Both sources ranked Southwest first, but they use different datasets and reporting methodologies.
OAG compiles global flight-status information and applies its own coverage and minimum-flight requirements. Its June North American ranking required at least 1,500 flights and sufficient tracking coverage.
The DOT report covers qualifying domestic scheduled operations reported by U.S. marketing carriers. Its figures are based on mandatory airline submissions and exclude portions of international flying that may appear in commercial tracking data.
The figures should therefore be used consistently. The decline from 79.75% in January to 64.94% in June is an OAG-to-OAG comparison. The DOT’s January-to-May series separately shows Southwest falling from 82.4% to 71.9%.
Both datasets reveal the same direction of travel, but the percentages should not be combined as though they came from one source.
A Partial July Improvement Does Not Yet Establish a Recovery
Early tracking indicated that Southwest’s on-time performance improved during the opening days of July.
A partial-month figure should not be compared directly with a completed monthly result. The sample is smaller, the weather pattern may be different, and one difficult weekend can change the final percentage significantly.
July also includes several operational challenges, including Independence Day traffic, heavy summer thunderstorms, high airport loads, and full flights that provide fewer rebooking options when disruption occurs.
Southwest will need to sustain improved performance through the entire month before it can credibly claim that June was the low point rather than part of a continuing trend.
The more meaningful indicators will be whether late-arriving-aircraft delays decline, whether the airline maintains its low cancellation rate, and whether it can prevent morning disruptions from spreading into the evening schedule.
A Delay Can Also Trigger a Refund
The original explanation suggests that Southwest has a financial incentive to delay flights instead of canceling them because canceled passengers are entitled to refunds.
That interpretation is incomplete.
Under the Department of Transportation’s airline refund requirements, a passenger is entitled to an automatic refund when an airline cancels a flight and the customer chooses not to accept alternative transportation.
A passenger can also qualify for a refund following a significant schedule change or delay when the traveler declines the alternative flight. For domestic itineraries, the DOT defines a significant arrival delay as three hours or more. The threshold is six hours for international travel.
A delayed flight does not automatically allow the airline to retain the passenger’s money regardless of how late it operates.
It is reasonable to say that completing a flight may be operationally preferable to canceling it. It is not supported to claim that Southwest deliberately preserves delayed flights primarily to avoid refunds.
Its low cancellation rate may reflect aircraft-positioning requirements, crew recovery, customer-service priorities, network design, or the operational feasibility of completing the flight later.
What Southwest Must Fix
Southwest does not need to choose between punctuality and schedule completion. The operational objective must be to improve both.
The airline’s first priority is reducing the number of delays caused by late-arriving aircraft. That requires protecting early departures, building realistic ground times, identifying rotations with insufficient recovery margin, and ensuring that spare aircraft and reserve crews are positioned where disruption occurs most frequently.
Schedule construction is equally important. A timetable can appear efficient under normal conditions while becoming fragile when thunderstorms remove 30 or 40 minutes of usable capacity at Denver (DEN), Baltimore (BWI), Chicago-Midway (MDW), or Orlando (MCO).
Aircraft utilization must leave enough room for the operation to recover rather than simply carry delay from one segment to the next.
Southwest must also evaluate the operational effects of assigned seating, its new boarding groups, the 737-700 cabin retrofit, and the increasingly mixed capacities within its all-737 fleet.
None of those changes necessarily caused June’s result. Together, however, they make 2026 one of the most significant operational transition years in the airline’s history.
Bottom Line
Southwest Airlines’ decline in on-time performance is real and substantial.
OAG ranked the carrier first in North America in January with a 79.75% on-time arrival rate. By June, that figure had fallen to 64.94%, placing Southwest last among the major U.S. airlines in the ranking and 17th among 18 qualifying North American carriers.
The airline’s low 0.53% cancellation rate provides important context. Southwest continued operating nearly all of its flights, even as more than one-third arrived outside OAG’s 15-minute on-time window.
Federal data points to late-arriving aircraft as the largest individual source of delay. That is consistent with a network in which the same Boeing 737 may operate several flights through airports such as Denver (DEN), Dallas-Love (DAL), Baltimore (BWI), Chicago-Midway (MDW), Las Vegas (LAS), and Phoenix (PHX) during one day.
Weather and FAA restrictions contributed to the disruption, particularly during the difficult June 19–21 weekend. They do not fully explain why Southwest finished well behind airlines operating through many of the same storms and air traffic constraints.
There is not yet sufficient evidence to blame a Southwest pilot shortage, assigned seating, or its aging Boeing 737-700 fleet. Those explanations require operational data that has not been made public.
Southwest’s central challenge is no longer simply completing its schedule. It must prevent the delay on one morning flight from becoming the delay on four or five later departures.
A return to the upper 70% range would demonstrate that June was a temporary low point. Until Southwest sustains that improvement across a full month, its slide from North America’s most punctual airline to the bottom of the major U.S. rankings remains one of the most consequential airline operating stories of 2026.
Keep reading FlyMag
Get the Daily Brief in the morning or the Route Watch weekly recap on Fridays. Or both.