United’s Quiet Retrenchment: 41 Airports See Fewer Flights in 2026
United Airlines is still in growth mode for 2026—adding new international flying and pushing more frequency through its hubs—yet the carrier is simultaneously dialing back service in a wide swath of smaller and mid-size markets.

Based on scheduled-flight data for the first half of 2026, United has reduced flying by at least 1% year-over-year in 41 cities. The cuts range from light, tactical trims (1–3%) to more meaningful reductions that reshape a station’s day-to-day utility. Importantly, this is a schedule story, not a flown-performance story: airlines routinely re-time, swap gauge, and re-bank frequencies as demand, costs, and aircraft utilization evolve.
Where the pullback is most visible: San Jose (SJC) and Bakersfield (BFL)
The sharpest reduction lands at San Jose Mineta (SJC)—United’s most heavily trimmed airport in the dataset—where scheduled flying is down about 25% year-over-year.
Read our stories in your inbox
Two aviation newsletters. Zero fluff.
SJC is a particularly telling case because it’s a high-profile business market sitting in a region where United already has massive scale at San Francisco (SFO). When the carrier wants to concentrate connectivity, premium demand, and operational resilience, SFO is the natural magnet. As a result, SJC often functions as a “precision spoke” in United’s system—useful, but more vulnerable to trimming when the network is being optimized.
United’s SJC service is primarily built around hub links to Denver (DEN), Houston Intercontinental (IAH), and Chicago O’Hare (ORD). The biggest reductions are concentrated on the DEN–SJC and ORD–SJC lanes, where frequency matters most to business travelers. Dropping even one daily round-trip can meaningfully reduce schedule choice, especially for day trips and same-day connections.
Bakersfield (BFL) is another standout. United’s scheduled flying on San Francisco (SFO)–Bakersfield (BFL) is down 17.3%, with the route moving to a slimmer baseline versus the prior year. This is classic “right-sizing” on a short-haul, high-frequency market where a small change in daily cadence has outsized impact on connection banks and local convenience.
The pattern behind the reductions: right-sizing spokes, not retreating from hubs
The list of reduced markets tells a consistent story: United is concentrating flying where it can defend revenue premiums and connection utility, while trimming lower-performing segments—especially in stations that tend to rely on:
-
Regional lift (where aircraft availability, crew pipelines, and maintenance cycles can be tight)
-
Thin business demand outside peak days
-
Leisure volatility, particularly where consumers shift quickly to alternative gateways
A few clusters jump out:
California and the West
-
Beyond SJC (San Jose) and BFL (Bakersfield), reductions appear at Monterey (MRY), Fresno (FAT), San Luis Obispo (SBP), Burbank (BUR), and Santa Ana/Orange County (SNA)—markets that often compete with larger nearby airports or are highly season-dependent.
Texas and the Gulf
-
Multiple Texas stations are trimmed, including Brownsville (BRO), McAllen (MFE), Harlingen (HRL), El Paso (ELP), and Midland/Odessa (MAF). These are frequently tied to energy, cross-border commerce, and corporate travel patterns—segments that can swing with macro conditions and contract cycles.
Smaller interior markets
-
Colorado Springs (COS), Billings (BIL), Bismarck (BIS), Williston (XWA), Fargo (FAR), and Kalispell/Glacier Park (FCA) reflect the kind of station where adding or subtracting a handful of weekly flights can be the difference between “usable” and “inconvenient.”
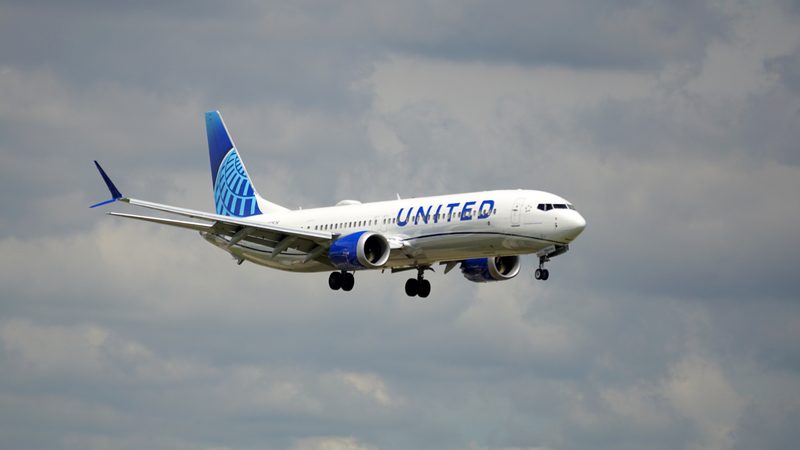
In many of these markets, United’s schedule is typically a mix of mainline narrowbodies (Boeing 737 and Airbus A320-family) and a substantial amount of regional capacity (notably Embraer 170/175-class flying). That mix is flexible—but it’s also where airlines most often adjust frequency to protect yields and aircraft utilization.
International touchpoints: modest trims where capacity is easier to flex
While most of the reductions are domestic, several international airports appear on the list—generally with smaller percentage cuts:
-
Frankfurt (FRA) down 1.5%
-
São Paulo–Guarulhos (GRU) down 4.6%
-
Bogotá (BOG) down 3.9%
-
Panama City, Panama (PTY) down 11.4%
-
Guatemala City (GUA) down 2.2%
-
San Salvador (SAL) down 1.4%
-
Monterrey (MTY) down 1.4%
These trims are often driven by schedule tuning rather than strategic retreat: swapping seasonal frequency, adjusting bank times, or redeploying widebody hours to markets where yields are stronger. FRA is especially notable because it’s a cornerstone Star Alliance gateway and joint-venture-heavy market—meaning even small frequency changes can be tied to broader alliance coordination and aircraft assignment.
Growth still leads the story: where United is adding lift in 2026
The cuts don’t exist in a vacuum. United is still building out long-haul and “long-thin” flying—often precisely the type of expansion that requires fine-tuning elsewhere to keep the fleet productive.
A few examples of where the airline is adding capacity and new flying in 2026:
-
Newark (EWR)–Split (SPU) using Boeing 767-300ER (seasonal)
-
Newark (EWR)–Bari (BRI) using Boeing 767-300ER (seasonal)
-
Newark (EWR)–Glasgow (GLA) using Boeing 737 MAX 8 (seasonal)
-
Newark (EWR)–Santiago de Compostela (SCQ) using Boeing 737 MAX 8 (seasonal)
-
Washington Dulles (IAD)–Reykjavík (KEF) using Boeing 757-200 (seasonal)
-
Newark (EWR)–Seoul Incheon (ICN) using Boeing 787-9 (year-round)
That mix—767s for premium-heavy leisure, 737 MAX for transatlantic “right-sized” growth, 757s for medium-long missions, and 787s for trunk long-haul—illustrates the broader strategy: keep expanding where the economics work, then rebalance domestic and marginal markets to support it.
The full list: 41 airports seeing fewer United flights in H1 2026
San Jose, CA (SJC) — 622 flights (down 25%)
Bakersfield, CA (BFL) — 589 (down 17.3%)
Brownsville, TX (BRO) — 714 (down 15.8%)
McAllen, TX (MFE) — 1,016 (down 14.6%)
Mobile, AL (MOB) — 930 (down 14.4%)
Pasco, WA (PSC) — 624 (down 13.2%)
Panama City, Panama (PTY) — 807 (down 11.4%)
Harlingen, TX (HRL) — 696 (down 8.5%)
Colorado Springs, CO (COS) — 2,422 (down 8.5%)
Guam (GUM) — 1,880 (down 8.3%)
Greensboro, NC (GSO) — 1,272 (down 8%)
Little Rock, AR (LIT) — 1,710 (down 7.8%)
Calgary, AB (YYC) — 992 (down 7.7%)
Shreveport, LA (SHV) — 981 (down 7.1%)
Albany, NY (ALB) — 1,335 (down 6.6%)
Panama City, FL (ECP) — 801 (down 5.5%)
Vancouver, BC (YVR) — 1,857 (down 5.3%)
Monterey, CA (MRY) — 1,064 (down 4.9%)
São Paulo–Guarulhos, Brazil (GRU) — 691 (down 4.6%)
Bogotá, Colombia (BOG) — 589 (down 3.9%)
Fresno, CA (FAT) — 1,674 (down 3.6%)
El Paso, TX (ELP) — 1,544 (down 3.3%)
Phoenix, AZ (PHX) — 5,972 (down 3.2%)
Midland/Odessa, TX (MAF) — 1,814 (down 2.6%)
Billings, MT (BIL) — 873 (down 2.6%)
San Luis Obispo, CA (SBP) — 1,243 (down 2.5%)
Guatemala City, Guatemala (GUA) — 991 (down 2.2%)
Tucson, AZ (TUS) — 1,975 (down 2%)
Burbank, CA (BUR) — 1,557 (down 2%)
Kalispell/Glacier Park, MT (FCA) — 726 (down 1.9%)
Bismarck, ND (BIS) — 750 (down 1.8%)
Williston, ND (XWA) — 711 (down 1.7%)
Frankfurt, Germany (FRA) — 1,601 (down 1.5%)
Toronto, ON (YYZ) — 3,844 (down 1.5%)
Monterrey, Mexico (MTY) — 1,388 (down 1.4%)
San Salvador, El Salvador (SAL) — 907 (down 1.4%)
Knoxville, TN (TYS) — 2,340 (down 1.4%)
San José del Cabo, Mexico (SJD) — 1,657 (down 1.3%)
Charlotte, NC (CLT) — 2,724 (down 1.1%)
Fargo, ND (FAR) — 1,215 (down 1%)
Santa Ana/Orange County, CA (SNA) — 3,523 (down 1%)
Bottom Line
United’s H1 2026 reductions across 41 airports look less like a broad pullback and more like a disciplined network tune-up: trimming frequency where it underperforms, consolidating flying toward larger hubs, and freeing aircraft time for higher-impact growth—especially transatlantic and long-haul flying from hubs like Newark (EWR) and Washington Dulles (IAD). If you’re watching for signal, focus on the deepest cuts—San Jose (SJC) and Bakersfield (BFL)—because those are the places where a schedule change can materially alter how competitive (and how convenient) United is on the ground.
Keep reading FlyMag
Get the Daily Brief in the morning or the Route Watch weekly recap on Fridays. Or both.